
How to Look Up McHenry County Jail Population Data
Jail population data for McHenry County lives in several official places at once, and no single web page collects them all. The starting point is the McHenry County Sheriff's corrections division, which runs the jail and publishes the official corrections information page. Sheriff annual reports, when posted in a given year, are the most direct local source for capacity, average daily population, bookings, and staffing.
The next layer is the county budget. The McHenry County government site posts annual budget books that fund the Sheriff and the jail. Budget pages often disclose corrections staffing levels, jail operations costs, food and medical line items, and contracted services. These numbers are not the same as a daily inmate count, but they reveal the scale of the operation.
National and state context is published by the Bureau of Justice Statistics for national jail trends and by the Vera Incarceration Trends tool for county-level estimates. Vera uses BJS and state data to build a county-level trend view that helps spot long-run changes. Read each source on its own terms. A BJS national rate, a Vera county estimate, and a Sheriff annual count measure related but different things.
The corrections information page is the place to verify which official documents the Sheriff currently publishes. The page is updated more often than printed reports, and it points to the systems that handle bookings, releases, and visitor rules.
The image below is from the official McHenry County Sheriff corrections division page, which is the gateway to local jail information.

The corrections page lists the official inmate search systems, visiting rules, and contact methods for verifying any number that appears in a third-party source.
McHenry County Jail Capacity Overview
Capacity is the headline figure for any jail, but it is also one of the most misread numbers in corrections data. A jail can have a rated bed capacity set when the facility was built, while the usable capacity on any given day is lower because of classification rules, gender separation, medical or mental-health housing, protective custody, segregation, maintenance shutdowns, and staffing limits. A facility rated for several hundred beds may operate well below that ceiling without being undersized.
For McHenry County, specific local capacity and average daily population figures were not located in accessible county sources during this research pass. The table below records that gap honestly. Readers who need an exact bed count or ADP should pull the most recent Sheriff annual report, the current county budget book, or the Illinois jail inspection reports that the state publishes for adult correctional facilities.
| Facility | Stated capacity | Average daily population | Source status |
|---|---|---|---|
| McHenry County Adult Correctional Facility (Woodstock Government Center campus) | Not located in official accessible source | Not located in official accessible source | Research gap: verify Sheriff's annual report or county budget book before citing a number. |
The capacity question is not just about beds. It is also about whether the jail can safely classify and house every detainee at the moment a new booking arrives. Two people facing similar charges can require different housing if one has a medical need, a security flag, or a co-defendant conflict. That is part of why operational usable capacity is the number that drives daily decisions, not the rated capacity printed on a facility permit.
Note: Capacity figures change when a facility opens new pods, closes units for renovation, or shifts beds between male and female housing, so any number on this topic should be dated.
Average Daily Population
Average daily population, usually shortened to ADP, is the most common single measure of how full a jail is over time. It is the sum of the daily inmate counts across a period, divided by the number of days. ADP smooths out the day-to-day spikes caused by weekend bookings, court schedules, and bond hearings. It is the number that lets a county compare one year to the next or compare itself to a peer county on a similar scale.
For McHenry County, ADP is not published on a current public dashboard that this research pass could verify. The figure typically appears in Sheriff annual reports or in budget narratives. When ADP is cited from a third-party source, the date range matters. An ADP from a calendar year reads differently than an ADP from a fiscal year, and a peak month can hide inside a yearly average that looks moderate.
Two related counts often appear next to ADP. Peak daily count is the highest single-day count during the period, which is useful for capacity planning. Bookings per year measures intake events, not the population at one moment. A jail can have a high bookings count and a low ADP if most people leave within a day or two on bond, citation release, or transfer. The reverse is also possible. A jail with fewer bookings can still run a high ADP if the people held face serious charges and stay longer.
Demographic Breakdown
Demographic data on a jail population usually covers sex, age group, and race or ethnicity. Some counties publish charge-category breakdowns alongside the demographics. McHenry County does not publish a single open data file with these splits at the level this page would need to display them with confidence.
The honest path is to direct readers to the official sources that may contain demographic detail. Sheriff annual reports sometimes include male-female ratios and age bands. Illinois state-level corrections and court datasets contain demographic context that can be applied to local cases with care. The BJS Annual Survey of Jails publishes national demographic patterns that show how jail populations differ from the general population.
Care is needed when a national or state pattern is used to describe a local jail. National patterns can mask wide county-by-county variation across northern Illinois. Treat any borrowed statistic as context, label its source, and avoid presenting it as if it were a count drawn from the McHenry County Adult Correctional Facility itself.
Pretrial vs Sentenced Population
One of the most important splits in any jail population is the share held pretrial versus the share serving a sentence. Pretrial detainees have not been convicted on the pending charges. They are held because of court detention decisions, warrants, holds from other jurisdictions, or because they are not eligible for release under the current conditions. Sentenced jail inmates are serving a county sentence or waiting transfer to state custody.
Illinois changed its pretrial release framework substantially in recent years under the Code of Criminal Procedure, which now governs detention hearings and release conditions. The pretrial share in any Illinois jail today reflects the current law, the local court's detention decisions, and the underlying case mix. The split is not static, and a percentage from before the change should not be used to describe the present.
The exact pretrial and sentenced shares for McHenry County are not collected on a current public page that this research pass could verify. The split should be drawn from the Sheriff's annual report or from county detention data when those documents are available. Anyone citing the split should also note that pretrial does not mean unconvicted in a final sense. A pretrial detainee may be convicted later, acquitted, or have charges dismissed. The status describes the moment of the count, not the eventual outcome.
Misdemeanor vs Felony Population
Charge mix shapes how a jail population behaves. A jail full of misdemeanor traffic and ordinance holds turns over quickly, with short stays and high bookings. A jail with many violent felony detainees has a lower turnover, longer stays, and a higher pretrial share. Most county jails fall somewhere in the middle, with a small number of long-stay detainees pushing up the ADP while a large number of short-stay bookings dominate the intake count.
Common charge categories in an Illinois county jail include violent felonies, domestic violence, driving under the influence, probation and parole violations, drug offenses, retail theft, property crimes, traffic warrants, and out-of-county or out-of-state holds. The exact mix for McHenry County is not aggregated on a current public dashboard this research pass could verify. The Sheriff and the State's Attorney are the official sources for any local breakdown.
One trap to avoid is treating the top charge on a booking as the whole story. People can be booked on more than one charge, the lead charge can change after review, and a booking event is not a conviction. For individual case outcomes, the McHenry County court records docket is the official record. The jail roster shows custody status, not the final court result. The booking process itself runs through identity verification, fingerprints, photograph, property inventory, warrant checks, and medical or mental-health screening before classification and housing, which means the lead charge on a roster is the booking charge, not always the final charge that reaches court.
Mental Health and Medical Population
A modern county jail is also a medical and mental-health setting. A share of detainees on any given day is receiving medication, mental-health treatment, or specialized housing. Some are on suicide watch or under medical observation. Some are detoxing from alcohol or opioids during the first days of custody, which is a high-risk window in any jail.
McHenry County does not publish a detailed public count of medical or mental-health caseloads in the jail at a level this page can quote directly. The Sheriff's corrections information page lists the official contact path for medical questions, and county health and human services budgets fund some of the wraparound services. Mental-health court at the Circuit Court level connects qualifying defendants with treatment instead of standard custody, which can shift who appears in the jail population over time.
Security and medical flags inside the jail are not public records. Classification, suicide watch, protective custody, and treatment needs are managed by the jail and are not shown on the public roster. Families with medical concerns about a detained person should reach the jail through official channels, not assume the public roster reflects every condition or hold. Visit, mail, and money rules are also set by the Sheriff and change more often than court rules, so program counts inside the jail should be read against the current rule set.
National and State Context
National context for jail population comes from the Bureau of Justice Statistics, which publishes the Annual Survey of Jails and the Census of Jails. BJS reports national jail rates per 100,000 residents, pretrial shares, and demographic patterns. County-level trend context comes from Vera Incarceration Trends, which uses BJS and state data to build estimates for individual counties.
The comparison table below sets up the framing without inventing local figures. Local McHenry County jail rates must be verified from the Sheriff's annual report or from county documents before any specific number is cited in print. The table calls out what each source measures and what it does not.
| Geography | Jail rate per 100,000 | Source | Year basis | What it measures |
|---|---|---|---|---|
| McHenry County, Illinois | Verify locally before citing | Sheriff annual report and county budget | Fiscal or calendar year as published | Local detainees held at the McHenry County Adult Correctional Facility. |
| Illinois statewide context | See Vera county-level dataset | Vera Incarceration Trends | Most recent estimate year published by Vera | Vera estimate built from BJS and state data; useful for trend, not for spot counts. |
| National context | See BJS Annual Survey of Jails | Bureau of Justice Statistics | Year of most recent BJS publication | National jail rate based on the Annual Survey of Jails and Census of Jails. |
The image below is from the official Bureau of Justice Statistics page, which is the federal source of jail and corrections data referenced for context on this page.
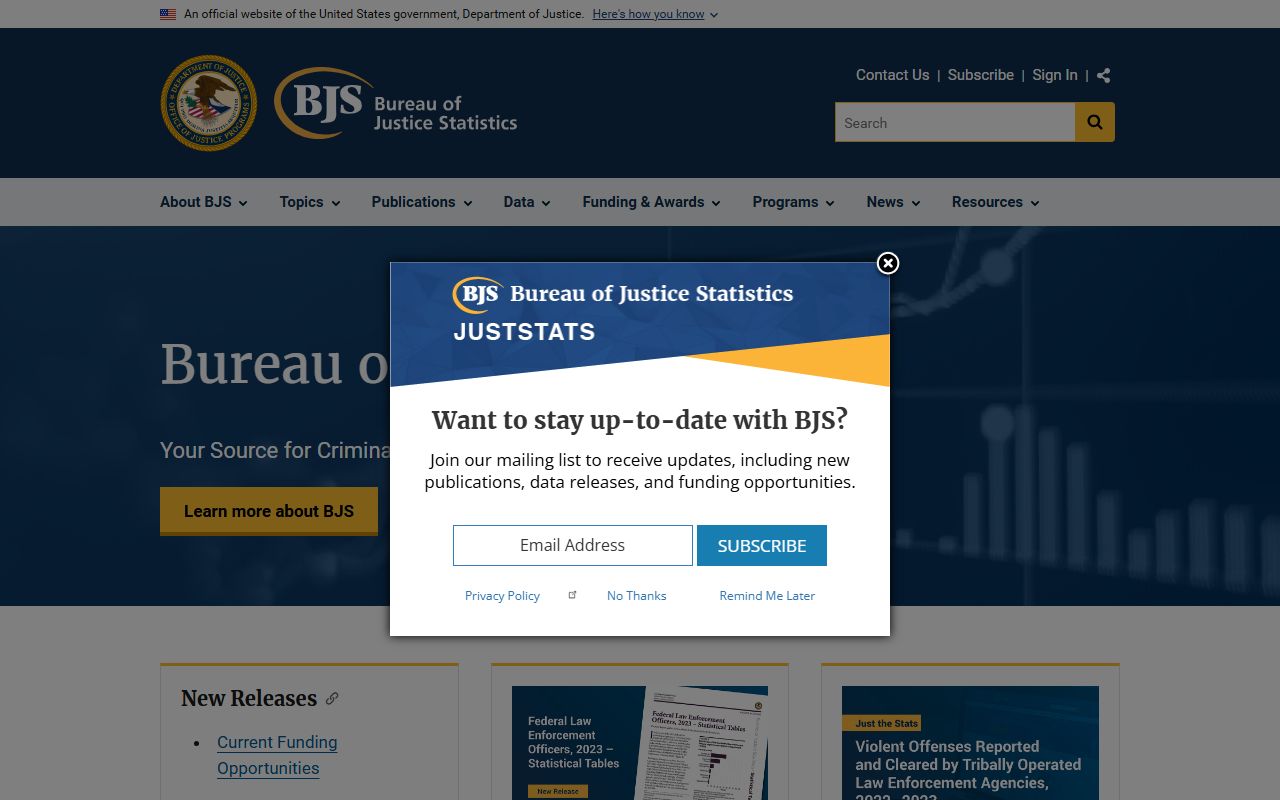
BJS publishes national data, so its numbers should be read as background. They do not replace a Sheriff annual report or a county budget book for any local citation.
For state-prison context, the Illinois Department of Corrections individual in custody search covers sentenced state-prison inmates, who are a separate population from county jail detainees. State prisons and county jails have different intake rules, classification, sentence ranges, and reporting cycles. Mixing the two without labeling them is a common mistake in jail population reporting.
Population Trends Over Time
Trends in a county jail population usually run on multi-year cycles. A five-year window is the smallest one that shows a pattern, and a ten-year window is better when policy changes or major events are involved. Many U.S. counties saw jail populations drop sharply in 2020, level off through the pandemic years, and then partially rebound. Whether McHenry County followed that pattern in detail must be supported by the Sheriff's data, not asserted by analogy.
Several local forces can push the jail population up or down: Illinois pretrial reform, court backlogs, charging decisions by the State's Attorney, policing patterns by the Sheriff and municipal departments, mental-health and substance-use service availability in the region, and out-of-county hold volume. No single force usually explains a year-over-year change on its own. The careful approach is to name several factors when a trend is described and to cite which official report supports the description.
The county does not publish a simple public five-year jail population dashboard that can be linked here as the one source of truth. Readers who need the trend should pull the relevant Sheriff annual reports, county budget books, Illinois jail inspection reports, and the Vera county-level dataset, and read them together. If the numbers in different sources disagree, the right move is to identify how each one is defined rather than force them to match.
Population Measures You Will See in Jail Data
Jail data uses a small set of recurring terms. Reading any official report is easier when the terms are pinned down first.
- Average Daily Population (ADP)
- Sum of daily inmate counts across a period divided by the number of days in that period. The standard size measure for jail population over time.
- Bookings
- Intake events in a period. One person can be booked more than once in a year. Bookings measure flow, not the population at a single moment.
- Pretrial vs Sentenced
- Pretrial detainees are held while charges are pending. Sentenced inmates are serving a county sentence or waiting transfer. The split changes with local detention decisions and case mix.
- Length of Stay
- How long a typical detainee remains in custody. Often reported as an average or a median. Long stays push ADP up even when bookings are flat.
- Rated Capacity vs Usable Capacity
- Rated capacity is the bed count set when the facility was permitted. Usable capacity is the count the jail can safely operate today given classification, staffing, and maintenance.
A report that uses these terms consistently is easier to trust than one that switches between them. If a source quotes a single number without saying which measure it is, treat the number as a starting point and confirm the measure before citing it.
Searching for McHenry County Inmate Records by Name
This page covers aggregate jail population data, not individual people in custody. To look up a specific person by name, use the official county inmate lookup. The walkthrough lives on the McHenry County inmate records page, which covers the search-field layout, the sample profile fields, and the verification steps when custody status is time-sensitive. For information on release verification and state or federal custody, see the released inmates page. For active warrants tied to a person, see the warrant records page.
What this page is and is not. This page is population and aggregate context, not an individual roster. Custody status, charges, and bond information for one person belong on the inmate records page and in the official county inmate search. Use the population page to understand scale, trend, and source quality, then move to the roster page to look up a specific name.
Where the Data Comes From
Official sources for McHenry County jail population data fall into three layers. The first is local: the Sheriff's Office and the corrections information page run by the Sheriff. The Sheriff's annual reports and the public statements of corrections leadership are the most direct source for capacity, ADP, bookings, and program activity inside the jail.
The second layer is county government. The McHenry County government site publishes the annual budget book that funds the Sheriff and the jail. The budget often includes corrections staffing levels, contracted services, food and medical line items, and cost-per-day figures. Budget data does not replace operational counts, but it gives a sense of scale and of priorities. The Circuit Clerk publishes court case data that helps explain part of the jail flow, even though the Clerk does not run the jail.
The third layer is state and national. Illinois jail inspection and standards reports are produced under state oversight programs. BJS publishes the national jail context and methodology. Vera Incarceration Trends builds county-level estimates from BJS and state data. The Illinois Courts self-help center is the entry point for people who want to understand the legal framework that shapes who ends up in custody and for how long.
For state-prison context that sits outside the county jail, the Illinois Department of Corrections individual in custody search is the official source. State prisons and county jails have separate intake, classification, and reporting systems, so the two should be reported separately and not added together without care. For an overview of how the McHenry County booking process feeds the jail count, see the inmate records page. For frequently asked questions about court and custody data, see the FAQ page.
Note: Always date the source. A jail capacity figure from a five-year-old annual report can mislead even when the underlying number is correct, because pods, classification, and operational capacity change over time.